Reading--Notes
Charts
Charts are far better for displaying data visually than tables and have the added benefit that no one is ever going to press-gang them into use as a layout tool. They’re easier to look at and convey data quickly, but they’re not always easy to create.

- Setting up :
The first thing we need to do is download Chart.js. Copy the Chart.min.js out of the unzipped folder and into the directory you’ll be working in. Then create a new html page and import the script.
- Drawing a line chart :
-
To draw a line chart, the first thing we need to do is create a canvas element in our HTML in which Chart.js can draw our chart.
-
Next, we need to write a script that will retrieve the context of the canvas.
-
Inside the same script tags we need to create our data, in this instance it’s an object that contains labels for the base of our chart and datasets to describe the values on the chart.
Canvas
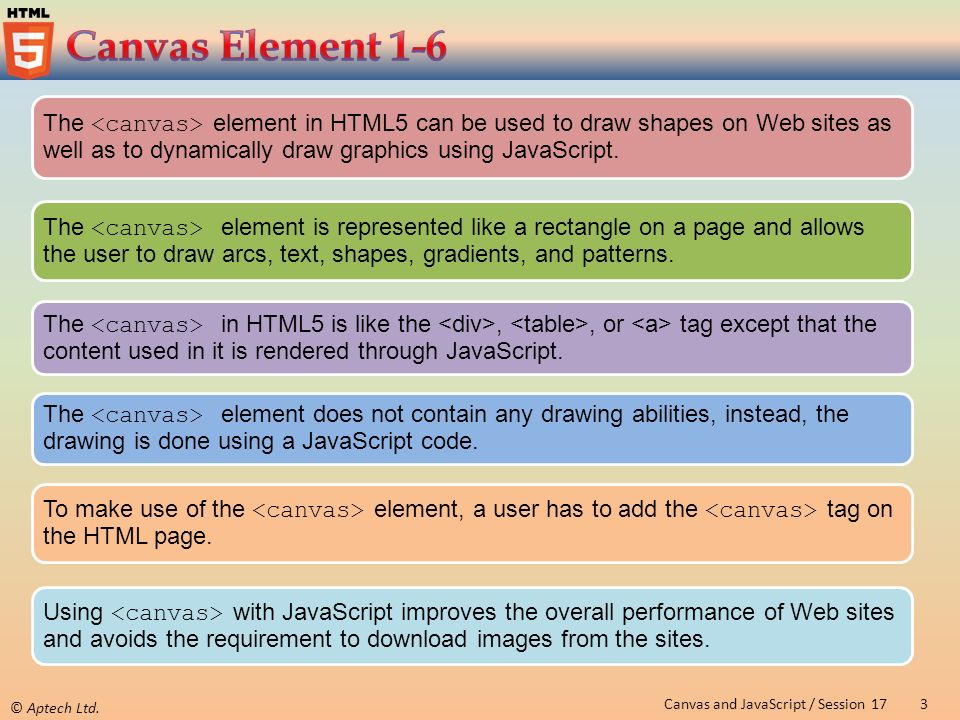
The HTML canvas element is used to draw graphics on a web page.
see the example below :

Drawing shapes with canvas :
- Drawing rectangles :
- Drawing a circle :

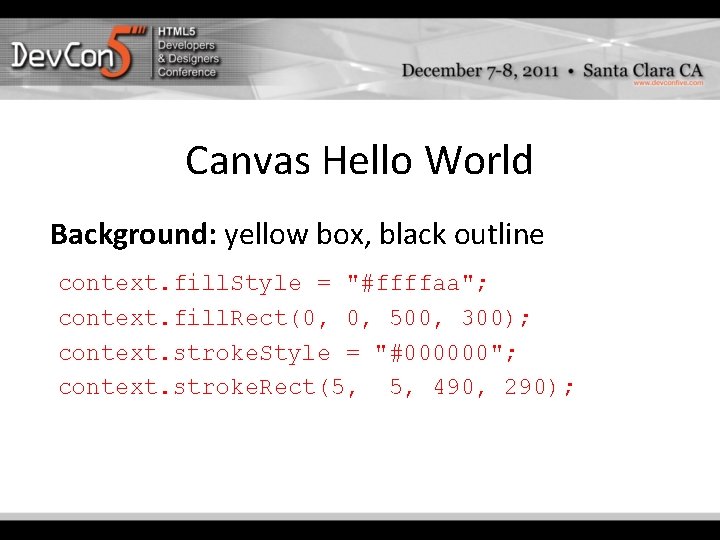
Applying styles and colors :
Here we will explore the canvas options we have at our disposal to make our drawings a little more attractive.
- Colors:
if we want to apply colors to a shape, there are two important properties we can use: fillStyle and strokeStyle.

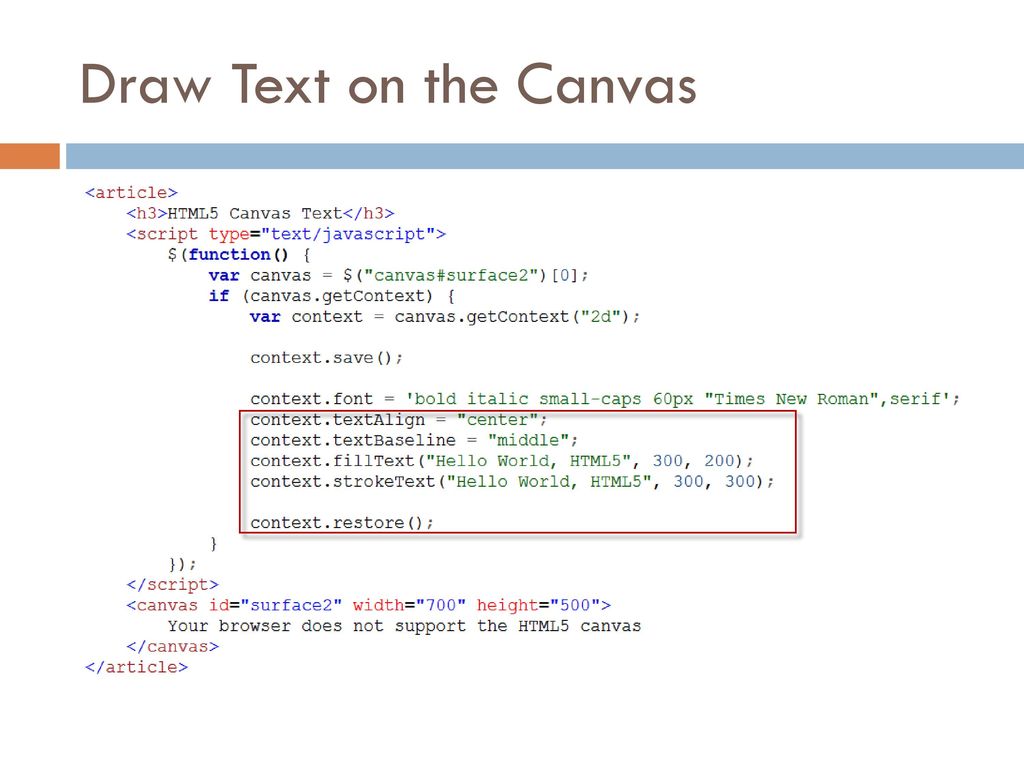
Drawing text :
The canvas rendering context provides two methods to render text:
-
fillText(text, x, y [, maxWidth]) : Fills a given text at the given (x,y) position. Optionally with a maximum width to draw.
-
strokeText(text, x, y [, maxWidth]) : Strokes a given text at the given (x,y) position. Optionally with a maximum width to draw.